Per-Day Costs
(FY27 budget, function 1050, excluding OoC pass-through)
(Linn County and Henry County contracts, 2024–25)
Linn County charged U.S. Marshals $86–$140/day for the same beds
No pro-forma operating budget for the new facility has been published
The $315/day in-house figure
The FY27 Total Expenses Budget breaks out the Sheriff's Office by function code. Function 1050 is the jail. Its total is $7,186,029, which includes $800,000 for SC349 — Inmate Housing, Out of County. That line is a pass-through to other counties, not a cost of operating the Johnson County jail. Removing it yields an in-facility operating cost of $6,386,029.
Divided by the FY26 partial in-house ADP of 55.62 × 365 days: $6,386,029 ÷ 20,302 = ~$315/day per person.
Personnel and benefits account for 89% of that cost (FY27 Total Expenses Budget, Function 1050: $5,689,901 personnel+benefits ÷ $6,386,029 in-facility cost).
Show FY27 Function 1050 line-item budget
| Line item | FY27 budget |
|---|---|
| SC100 Salaries of Regular Employees | $3,708,064 |
| SC101 Wages of Temporary & Part-time | $120,739 |
| SC104 Overtime & Shift Pay | $173,710 |
| SC111 IPERS (pension) | $424,813 |
| SC113 Employee Group Health Insurance | $912,392 |
| SC114 Allowances to Employees | $11,520 |
| SC117 Other Benefit Programs | $45,760 |
| Social Security | $292,903 |
| Total personnel and benefits | ~$5,689,901 |
| SC230 Commodities — Food & Provisions | $331,000 |
| SC231 Clothing & Dry Goods | $11,000 |
| SC234 Kitchen Supplies | $6,500 |
| SC291 Medical & Laboratory Supplies | $5,000 |
| SC294 Wearing Apparel & Uniforms | $30,000 |
| SC302 Primary Treatment | $18,000 |
| SC306 Prescription Medication/Vaccines | $80,000 |
| SC349 Inmate Housing — Out of County | $800,000 |
| SC378 Contracted Coordination Services | $13,000 |
| SC413 Mileage & Other Travel Expenses | $47,100 |
| SC422 Educational & Training Services | $84,625 |
| SC447 Repair & Maintenance — Misc. | $16,041 |
| SC453 Rentals — Office Equipment | $5,137 |
| SC634 Household & Institutional | $4,200 |
| SC636 Office Equipment & Furniture | $6,650 |
| Other misc. | ~$194,875 (est.) |
| Total non-personnel | ~$1,496,128 |
| Function 1050 Total | $7,186,029 |
Source: JoCo FY27 Total Expenses Budget, CC08 Sheriff, Function 1050 (Jail). SC349 ($800,000) excluded from the in-facility per-diem calculation as an intergovernmental pass-through.
The 65-bed cap in historical context
Sheriff Kunkel stated in May 2024 that he caps in-house population at approximately 65. The monthly control sheets support two readings of that cap. Pre-COVID stable years (FY17–FY19) show an average in-house ADP of approximately 62.2/day — just below 65, consistent with a cap that was being approached but not exceeded. Post-COVID stable years (FY22–FY26 partial) show an average of approximately 55.5/day — roughly 10 below the stated cap. The two readings are: (a) the cap is unchanged at 65 and post-COVID demand simply dropped; or (b) the cap was tightened de facto after COVID, and the 65 figure reflects an earlier, looser practice. Distinguishing between them requires daily peak data. The monthly control sheets report monthly averages only; daily peaks are not published.
The $60/day out-of-county rate
Johnson County pays $60/day to Linn County (Cedar Rapids) under a 2024 agreement with a 4% annual escalator, and $60/day to Henry County from FY2025 (up from $50/day). Washington County charges the same $60/day, per the January 2026 State inspection sheet. The Sheriff's snapshot (slide 10) lists Cedar at $65/day and Clinton at $55/day; the Lee County rate is not publicly reported.
Johnson County's claims registers confirm the Washington County rate to the penny. "Inmate Housing Dec25" was $12,900: exactly 215 prisoner-days × $60. "Inmate Housing Jan26" was $6,420: exactly 107 prisoner-days × $60 (claims registers, January 29 and February 12, 2026 formal agendas). The posted rate is the paid rate.
The $60/day figure is a transfer rate between counties — what intergovernmental negotiation produced — not necessarily a measure of what it costs to run a jail. Linn County previously charged the U.S. Marshals Service $86–$140/day for the same beds (The Gazette, 2024).
Comparing Johnson County's average in-house cost ($315/day) directly to the $60 transfer rate conflates a fully-loaded average cost with a sub-cost intergovernmental rate. The two figures are not measuring the same thing.
The receiving jail has room. Washington County's jail was built in 2007 and holds 84 beds. On inspection day, January 29, 2026, 23 beds were occupied, leaving 61 empty beds about 30 miles from Iowa City. The census is a one-day snapshot. The same State inspector who inspects the Johnson County jail inspected Washington County's and marked zero non-compliance items. The inspection report and cover letter are available for download.
The $960K standing budget — the OoC pressure point is partly an artifact
The OoC budget line has been static at $960,000 across every published year through FY26. Sheriff Kunkel confirmed at his November 2024 budget presentation:
Standing budgeted amount of $960,000 — in place before I came into office. This number can fluctuate over time, always kept budgeted amount static in case of emergency.
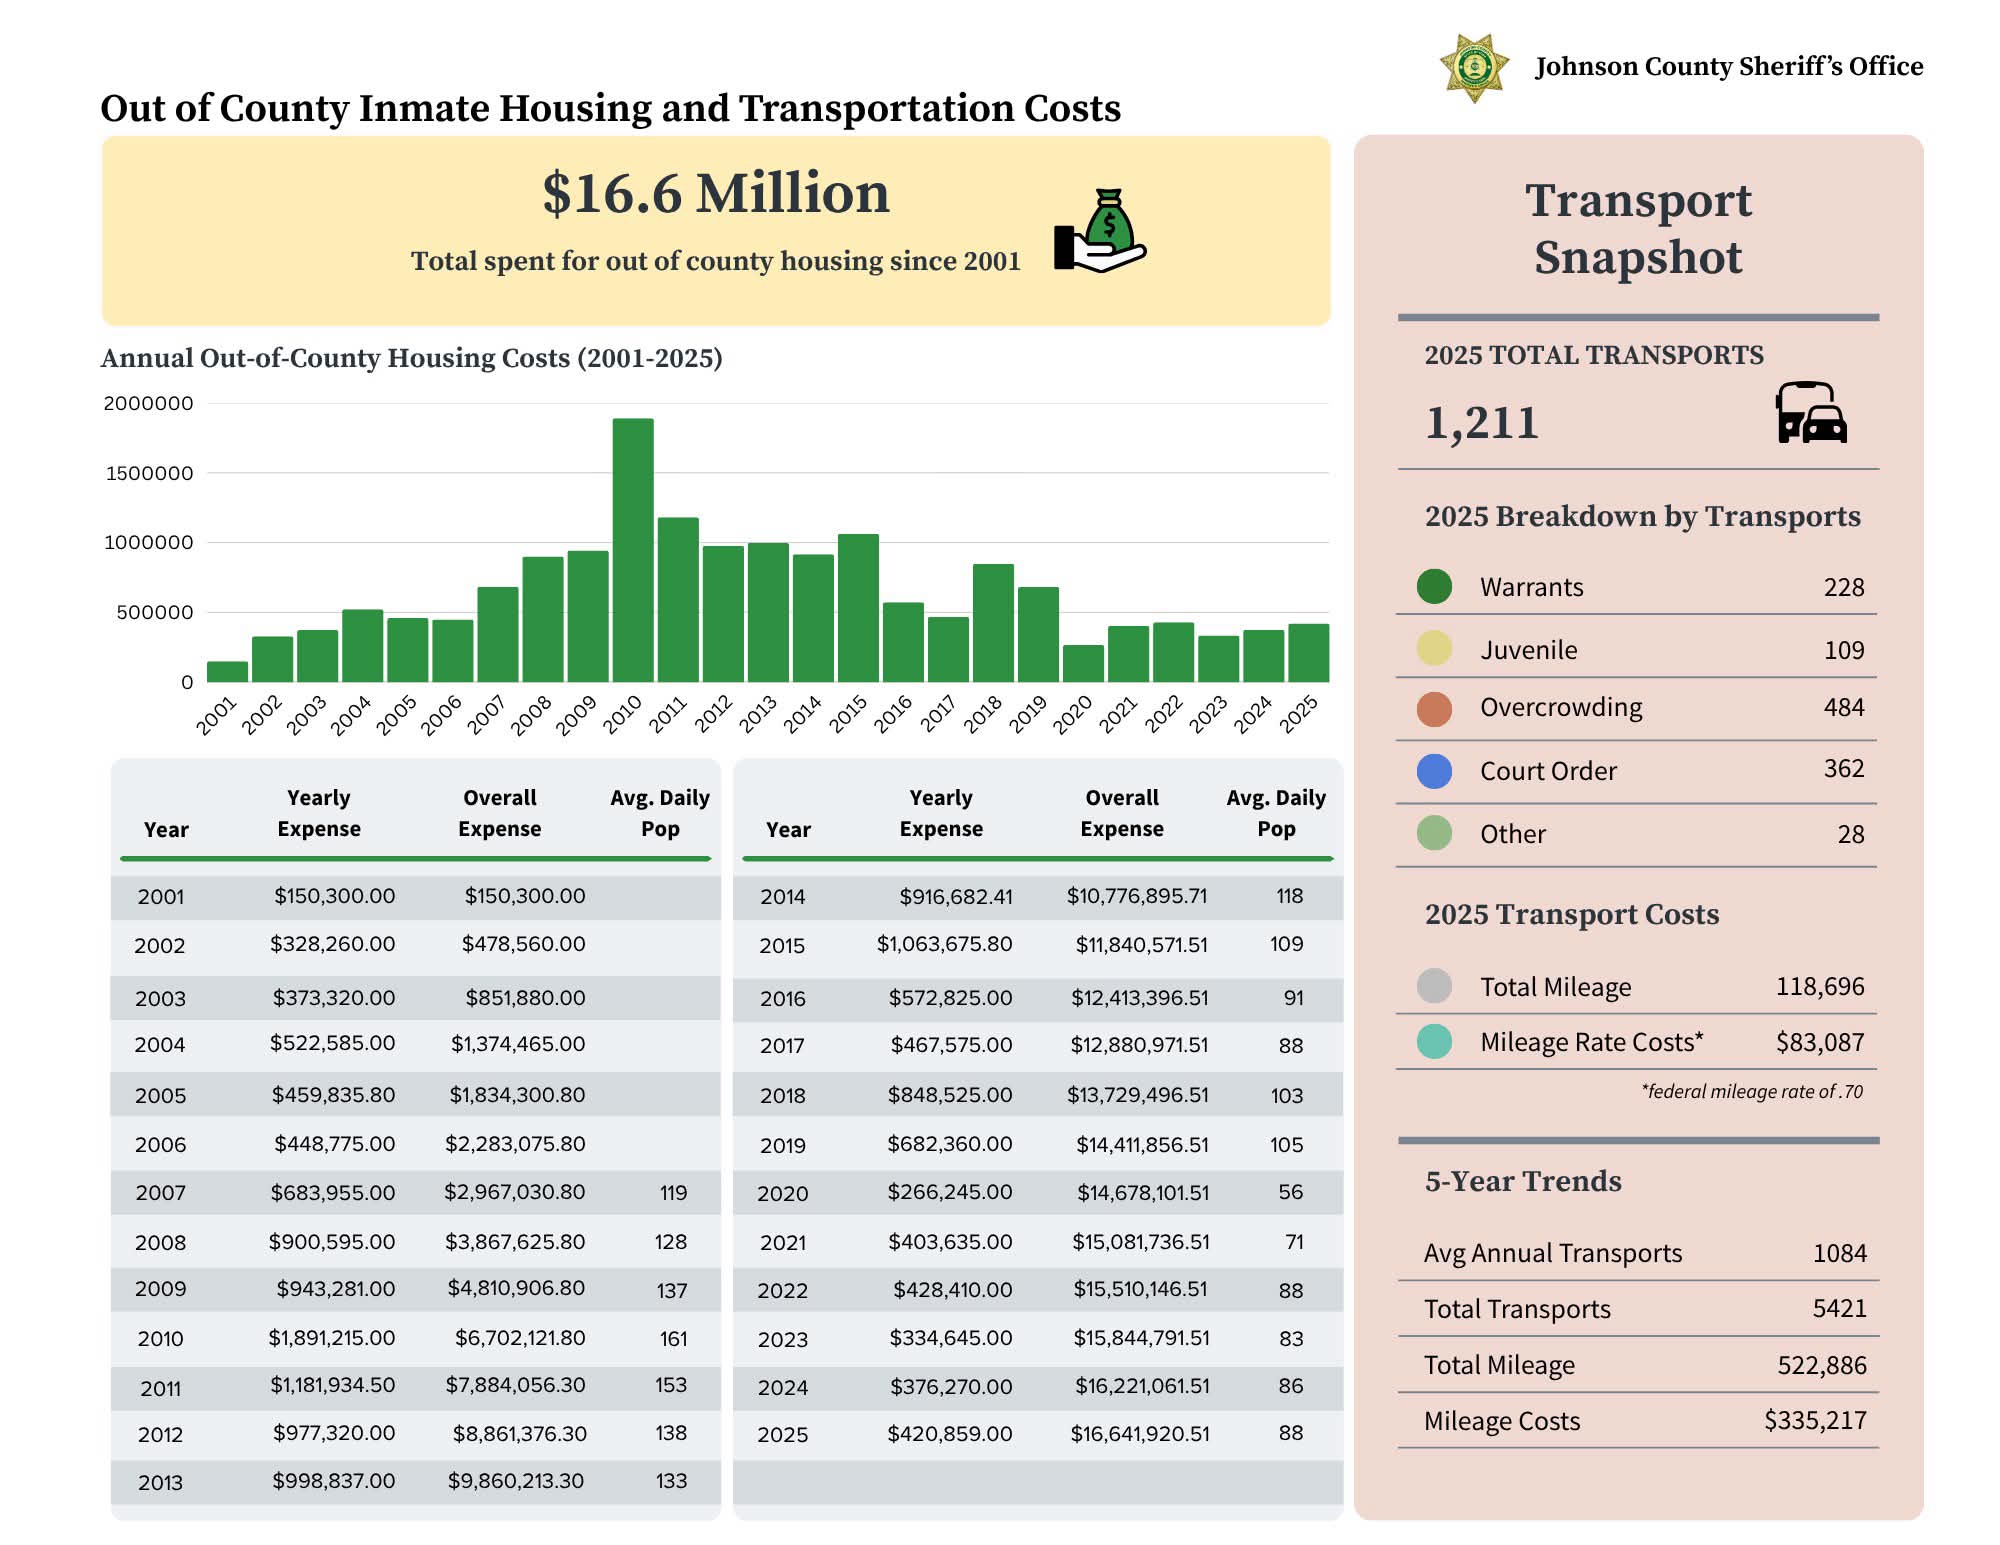
Kunkel took office January 2017. FY23–FY25 actuals were $331K–$440K — between 35% and 46% of budget. The FY27 line drops to $800K with no published justification. The "$800K projected OoC pressure" framing in bond-justification materials uses a budgeted number two-to-three times what the County has actually spent in any year since 2015. Actual OoC spending peaked in calendar year 2010 at $1.89M and has trended downward since 2015.
Show FY17–FY27 out-of-county housing history
| FY | Actual spend | OoC ADP | Implied per-diem |
|---|---|---|---|
| FY17 | $451,085 | 23.52 | ~$52/day |
| FY18 | $827,105 | 39.73 | ~$57/day |
| FY19 | $648,750 | 36.54 | ~$49/day |
| FY20 | $531,055 | 28.89 | ~$50/day |
| FY21 | $302,155 | 16.35 | ~$51/day |
| FY22 | $459,205 | 27.28 | ~$46/day |
| FY23 | $326,805 | 18.28 | ~$49/day |
| FY24 | $303,120 | 16.98 | ~$49/day |
| FY25 | $440,380 | 21.85 | ~$55/day |
| FY26 (partial, 6 mo) | $240,319 | 24.49 | ~$54/day |
| FY27 (budgeted) | $800,000 | — | — |
Source: Johnson County Sheriff's Office control sheets (FY17–FY26 partial). Implied per-diem = actual spend ÷ (OoC ADP × 365). FY27 is budgeted, not actual. The implied per-diem rose from ~$46–$52 (FY17–FY23) to ~$54–$55 (FY24–FY26), consistent with contract rate increases. FY27 budget of $800K is ~2.6× the FY24 actual.
Comparison table
| Housing type | Rate | Source |
|---|---|---|
| JoCo in-house (FY27 budget basis) | ~$315/day | JoCo FY27 budget, function 1050 |
| JoCo pays Linn County | $60/day | 2024 contract (4% annual escalator) |
| JoCo pays Henry County | $60/day | FY2025 contract |
| JoCo pays Washington County | $60/day | Jan 2026 State inspection sheet; claims registers (exact $60 multiples) |
| Linn County charged U.S. Marshals (prior) | $86–$140/day | The Gazette, 2024 |
| Iowa state prisons (avg) † | ~$116/day | Iowa Legislature FY data |
† Iowa state prisons house longer-term sentenced incarcerated people with different programming, medical, and security cost structures than county jails. The $116/day figure is included as a reference benchmark only and is not directly comparable to county jail operating cost.
The Sheriff is already cutting per-position cost via civilianization — independent of any new facility
Job Bulletin #00852 (Detention Officer, posted May 5, 2025) lists the wage at $29.68/hour — approximately $61,700 base salary. The position is female-only under Iowa Code §356.5 BFOQ. In his FY26 and FY27 budget planning forms, Sheriff Kunkel documented the per-position savings from civilianizing Deputy Sheriff positions through attrition:
We will continue operating under the new jail staffing model by filling open deputy sheriff positions with civilian detention officers. This is saving an estimated $14,000 in salary and benefits plus an additional $10,000+ in ILEA expenses per position.
Total documented savings: ~$24,000/year per civilianized position. This is happening now, independent of any bond-funded facility. Two implications: (1) the elevated per-diem cost of the existing jail is in part a function of the staffing model, which the Sheriff acknowledges can be tightened; (2) any bond-campaign framing that treats the current operating cost as fixed and inflated by aging infrastructure ignores cost reductions the Sheriff has already identified and is implementing.
ADP in context: Johnson County vs. population
Normalizing ADP to county population helps contextualize the facility's actual use. Using U.S. Census Bureau Vintage 2024 Population Estimates for Johnson County (July 1 of the fiscal year start) and control-sheet ADP:
| FY | JoCo population (July 1) | In-house ADP | In-house per 100K | Total in-custody ADP | Total per 100K |
|---|---|---|---|---|---|
| FY22 | 155,035 | 50.99 | ~33 | 85.00 | ~55 |
| FY23 | 156,915 | 57.21 | ~36 | 81.71 | ~52 |
| FY24 | 157,528 | 56.82 | ~36 | 81.15 | ~52 |
| FY25 | 160,080 | 56.70 | ~35 | 84.08 | ~53 |
Population: U.S. Census Bureau, Population Estimates Program (PEP) Vintage 2024; July 1 estimates for Johnson County, Iowa (FIPS 19103). 2021–2023 from Vintage 2024 PEP; 2024 = 160,080 (Census QuickFacts). ADP from Johnson County Sheriff's Office control sheets. Total in-custody includes in-house + out-of-county housed + electronic monitor. FY21 (COVID recovery year) excluded; in-house ADP of 34.78 would yield ~22/100K. Table ends at FY25 because the Sheriff's dashboard "12 Month Trend" (Jun 2025–May 2026) is a rolling window straddling FY25 and FY26 — not a full fiscal year. See the Overview ADP section for the most recent rolling trend figures.
Capital Costs
The adopted bond totals $94.5M for the combined jail and Sheriff's Office facility. Because that covers both the jail and the SO, dividing the full bond by jail beds overstates per-bed cost. Shive-Hattery Vol. I (August 2024) split the combined facility at ~61% jail / ~39% law enforcement by cost; the county's bond site states the jail is 45% of the building by floor area; Sheriff Kunkel has publicly characterized the jail as approximately half the project. Per-bed cost varies substantially depending on which share is used:
| Scenario | Beds | Capital basis | Cost per bed |
|---|---|---|---|
| Full $94.5M ÷ 120 built-out beds (upper bound) | 120 | $94.5M | ~$788K/bed |
| Full $94.5M ÷ 140 beds (incl. 20 shelled) | 140 | $94.5M | ~$675K/bed |
| 61% jail share (Vol I split) ÷ 120 beds | 120 | ~$57.6M | ~$480K/bed |
| 50% jail share (Sheriff Kunkel) ÷ 120 beds | 120 | ~$47.3M | ~$394K/bed |
| Jail-only (Shive-Hattery Vol I 2024 estimate) | 120 | ~$48.88M | ~$407K/bed |
Confirmed post-2022 comparables (all combined Sheriff's Office + jail unless noted):
| Facility | Built beds | Cost | Per bed | Notes |
|---|---|---|---|---|
| Warrick County, IN (opened 2026) | ~300 | ~$50M final | ~$167K | Scale: ~2.5× JoCo's 120; per-bed cost falls with size. Source: WFIE/14News, June 24, 2026. |
| Kewaunee County, WI (2023) | 58 (85 expandable) | $25.6M approved; ~$33M rebid | ~$441K–$569K | Includes jail + 911/dispatch + Sheriff's Office (40,500 SF). Rebid after inflation. Source: Kewaunee County Star-News; WBAY, Aug 2023. |
| Otsego County, NY (2025 estimate) | 96 | $64.5M total / $53.7M construction | $672K total / $559K construction | Maximum-security; carries higher cost than standard county jail. |
| JoCo proposed (jail-only component) | 120 | ~$48.88M (Shive-Hattery 2024) | ~$407K | Does not include Sheriff's Office. Full $94.5M bond ÷ 120 beds = $788K. |
Per-bed cost is strongly size-driven: Warrick at ~300 beds comes in at ~$167K/bed; Kewaunee at 58 beds reaches ~$569K/bed; Otsego at 96 beds (maximum-security) reaches $672K/bed. JoCo's jail-only component at ~$407K/bed sits between Kewaunee and Warrick, adjusted for scale. The full $94.5M ÷ 120 = $788K figure includes the Sheriff's Office building and is not directly comparable to jail-only per-bed figures. Per-bed cost falls if the 20 shelled beds are included or if the facility runs at higher occupancy. All comparables should be verified against primary construction documents.
The per-square-foot trajectory: $752.61 to $850 in two years
The County's stated jail construction rate has risen twice since Vol. I. At the July 9, 2026 CJCC meeting, Sheriff Kunkel asked Shive-Hattery "is it $800? $850 a square foot?" and Shive-Hattery's Michael Lewis confirmed "$850 a square foot versus just about $600." The $850 is the jail side; the roughly $600 is the sheriff's-office side.
| Date | Stated jail rate | Source | Stated dollar-year basis |
|---|---|---|---|
| August 2024 | $752.61/SF | Shive-Hattery Vol. I | "Escalated to 2025 dollars" |
| August 14, 2025 | $800/SF | Joint-feasibility presentation | "Projected to 2027 dollars" |
| July 9, 2026 | $850/SF | CJCC meeting (Kunkel/Lewis exchange, Granicus clip 3697) | Not stated |
The chart below compares the County's stated rates against the Turner Building Cost Index, a standard national index of non-residential construction cost, rebased so its 2024 annual average equals the Vol. I rate of $752.61/SF. The index implies about $806/SF by mid-2026. The County's stated $850 runs 5 to 6 percent above construction inflation.
The same decomposition applies to the total. The combined estimate was $79.75M for 111,300 GSF in August 2024. The adopted bond cap is $94.5M for 118,500 SF, an increase of 18.5%. The Turner index rose about 7.3% over the same window. Floor area grew 6.5% (111,300 to 118,500 SF). Inflation and floor-area growth together explain about $91M. The rest is rate and scope mix.
The building has grown at each stage of planning: 35,000 SF, then 80,000 SF, then 118,500 SF (trajectory stated on the record by Supervisor Fixmer-Oraiz, July 9, 2026). The current building is 27,000 SF per Shive-Hattery Vol. I; the proposal is about 4.4 times the existing footprint. (The county's bond site says the current building is 28,500 SF, contradicting the county's needs assessment; at that figure the ratio is 4.2.) A cost estimate update on the 118,500 SF basis was announced at the July 9 CJCC meeting. No updated buildup has been published; the adopted cap is $94.5M.
Annualized capital cost per person per day
At $94.5M under the 12-year scenario, total debt service is $124.7M ($94.5M principal + $30.2M interest, per the Piper Sandler matrix), averaging ~$10.39M/year. That debt service, divided across occupied beds, produces the following capital cost per person per day — before any operating costs: At $94.5M under the 12-year scenario, total debt service is $124.7M ($94.5M principal + $30.2M interest, per the Piper Sandler matrix), averaging ~$10.39M/year. That debt service, divided across occupied beds, produces the following capital cost per person per day — before any operating costs:
| Occupancy | Prisoners/day | CapEx per person per day |
|---|---|---|
| Current in-house ADP | 56 | ~$508/day |
| Full managed ADP (incl. OoC and EM) | 84 | ~$339/day |
| Full 120-bed capacity | 120 | ~$237/day |
The Shive-Hattery Supplemental Life Cycle Cost Analysis states that the Build New scenario operates with 24 staff positions but does not publish a pro-forma operating budget — no per-person or annual operating cost figure appears in the document. The only primary-source-grounded all-in figure available is debt service plus current JoCo operating cost scaled to 84 ADP: $6.386M ÷ (84 × 365) = ~$208/day operating + ~$339/day debt service = ~$547/day.
This is a reference point, not a projection: it asks "what would today's operating cost per person be at the new facility's expected population?" Shive-Hattery's Build New scenario specifies 24 FTE, compared to the current jail's staffing embedded in the $5.69M personnel budget. Whether 24 FTE at a modern direct-supervision facility produces lower per-person operating cost than today cannot be evaluated without a published operating pro-forma. That document has not been released.
The debt service figure is fixed — it does not change with occupancy. The per-person share of that fixed cost falls as more people occupy the facility:
| Occupancy | ADP | Debt service/p/day |
|---|---|---|
| Current operational cap | 65 | ~$438/day |
| Current total managed ADP | 84 | ~$339/day |
| Initial built-out capacity | 120 | ~$237/day |
Debt service calculated as ~$10.39M/year average ($124.7M total under the 12-year Piper Sandler scenario) divided by occupancy × 365. The term is not fixed in any adopted document; at 20 years the annual average falls to ~$7.3M and the total rises to $146.1M. The 65-bed "operational capacity" is the Sheriff's figure used by Shive-Hattery; its basis has not been established in any published document (see Section 1).
Built to the Minimum, Designed for Growth
We're looking for specific situations that align exactly … with what the Iowa Jail Standard requires.
The schematic design presented at the July 9, 2026 CJCC meeting (Granicus clip 3697) treats the two halves of the building differently. The jail side is engineered to the Iowa Jail Standards floor (Iowa Administrative Code 201—50.8, the new-construction checklist the State Inspector uses). The sheriff's-office side has no code minimums and is where expansion happens.
The jail side against the state floor
| Element | IAC 201—50.8 minimum | Current jail | As designed | Margin (proposed) |
|---|---|---|---|---|
Single cell (occupied more than 10 hours/day)
Source (clip 3697, 23:10)"It works out to be 70 square feet in the cell." — Shive-Hattery presentation, CJCC meeting, July 9, 2026 (Granicus clip 3697, 23:10) | 70 SF [§50.8(1)a] |
~70 SF gross
NoteThe county's bond site states the current cells are “approximately 70 square feet.” The current jail (built 1981) is governed by the grandfathered §50.5 regime, not §50.8. A 70 SF single cell passes the §50.5 inspection checklist. | 70 SF | Zero |
Two-person cell (occupied more than 10 hours/day)
Source (clip 3697, 23:14 and 24:20)"A two-person cell … works out to be 92 square feet." — Shive-Hattery presentation, CJCC meeting, July 9, 2026 (Granicus clip 3697, 23:14). The calculation (clip 3697, 24:20): 2 occupants × 35 SF unencumbered = 70 SF, plus ~22 SF consumed by toilet, bunks, writing surface, and stool ≈ 92 SF gross. The 35 SF figure here is the §50.8(1)b cell standard; the identical figure at §50.8(2)d governs dayrooms and is stated per prisoner exclusive of fixtures — a separate requirement. | 35 SF unencumbered per occupant [§50.8(1)b] |
~70 SF gross (double-bunked)
Note on complianceThe current jail double-bunks two prisoners in the same ~70 SF cells. Whether that passes §50.5 depends on hours in the cell: ≤16 hours/day requires 60 SF for two (40 + 20), so 70 SF complies; >16 hours/day requires 80 SF (50 + 30), so 70 SF does not. The state inspector has found zero non-compliance items in both 2025 and 2026, which implies the ≤16-hour condition is met. No published document states the actual hours-in-cell figure or identifies which threshold the inspector applied. | 92 SF gross (70 SF unencumbered + ~22 SF fixtures) | Fixtures only vs. standard; 92 SF vs. ~70 SF current |
| Cell ceiling | 7 ft [§50.8(2)a] | Not published | 8 ft | +1 ft |
Dayroom (4-bed unit)
Source (clip 3697, 22:34)"If all four people are out in the day room, it's good to have a little bit of extra space." — Shive-Hattery presentation, CJCC meeting, July 9, 2026 (Granicus clip 3697, 22:34; standard stated at 22:46) | 35 SF per occupant = 140 SF [§50.8(2)d] | Not published | 231 SF | Surplus, justified as construction geometry |
| Unit circulation | Unencumbered space per standard [§50.8(2)d] | Not published | "within two square feet of the requirement" | ~Zero |
| Therapeutic and negative-pressure medical cells | No IAC minimum for these unit types | None | 14-bed therapeutic unit; two 3-person negative-pressure medical units | Above minimum by design choice (clip 3697, 27:26) |
† The 70 SF total-floor-space floor [§50.8(1)a] and 35 SF unencumbered-per-occupant minimum [§50.8(1)b] both apply when confinement exceeds 10 hours per day, except during administrative segregation or emergencies. Jail housing meets that condition. The dayroom 35 SF figure [§50.8(2)d] is a separate requirement measured per prisoner exclusive of fixtures. Three distinct standards share the same number; they are not interchangeable.
Context: Iowa’s new-construction standard for multi-occupancy cells has become less demanding over time. The rule in effect from 1984 to 2005 (§50.6) required 120 SF gross for a two-person cell (70 SF for the first prisoner + 50 SF each additional). The 2005 rule (§50.8) replaced that gross measure with an unencumbered-space standard and introduced the confinement-hours condition, producing the 92 SF gross design. The new jail’s two-person cells are smaller than what Iowa required for new construction through 2005.
Lewis presented the dayroom surplus as construction geometry, not amenity: bending the units into the sawtooth roofline would create corners, corners "create safety risks," and the straight layout carries "advantages from a construction and cost standpoint." On circulation, Lewis said the design is "within two square feet of the requirement … we try to be more exact than that." The one stated margin above the code floor is the ceiling: 8 feet against a 7-foot minimum.
The sheriff's-office side
No code sets minimum sizes for sheriff's-office space. The July 9 schematic includes:
- A 1,070 SF fitness room, about double the current ~500 SF.
- A 5,000 SF locker and wellness block sized for 130 staff, the full roster. Asked for a shift-based calculation, Lewis could not state one.
- A situation room and adjacent conference room totaling more than 2,000 SF.
- 1,000 SF of unassigned space. Supervisor Sullivan: "It doesn't bother me to have an extra thousand square feet."
- A 750 SF armory.
- An 8,000 SF storage building.
The design language for this half of the building is growth. Lewis: "This is planned for growth. It's planned to be flexible." Sullivan: "a building that's going to last 100 years." Sheriff Kunkel: "spaces that we need not only today, but that they're going to need in the future."
Minimums vs. as designed
Building to the legal floor is lawful. It is also cheaper per bed than exceeding it. The county's bond-site homepage criticizes the current jail's 70 SF single cells — but the new single cells are the same 70 SF. That is the floor Iowa law sets for any new jail built for confinement exceeding 10 hours per day. See the fact-check entry on cell size.
Three claims about the same square footage
First, the jail side is built to the state floor. The table above shows zero margin on cell size and circulation and one foot on ceiling height.
Second, the County presents that floor as cost discipline. Kunkel, July 9: "What we have here is a responsible plan."
Third, the County markets the project as a major improvement for the people held there. The ordinary housing units deliver the state minimum. What incarcerated people get above the 1981 building is the floor any new Iowa jail must meet.
Some inmate-facing elements do exceed the minimums: a 14-bed therapeutic unit, two three-person negative-pressure medical units, and the dayroom surplus, which exists for construction geometry. These are real but narrow. The discretionary comfort and growth space in the building sits on the staff side.
The July 1 packet puts jail functions at 45 percent of the 118,500 SF. The Iowa Administrative Code sets per-cell square footage only. It does not set the bed count, which is a policy choice, and it sets nothing on the sheriff's-office side.
The $69.4M Savings Claim
The $69.4M figure comes from Shive-Hattery's Supplemental Life Cycle Cost Analysis (July 2024). It is the difference between two projected 20-year scenarios:
- Build New: construct the 140-bed jail plus Sheriff's Office ($79.75M combined / $48.88M jail-only), operate with 24 staff.
- "Do Nothing" (forced-closure scenario): close the existing jail, build a holding facility ($13.6M–$50M), house all people held out of county at $60/day plus 2% annual inflation, operate an 18–30 staff transport unit.
Shive-Hattery's "Do Nothing" label describes a forced-closure scenario in which the existing jail is taken offline and all people held out-of-county. The County has not made that closure decision, no regulatory order requires it, and the existing jail's State Inspector record shows zero non-compliance items in both 2025 and 2026. This is a forced-closure comparison, not a comparison to the current status quo.
The actual annual OoC spend is $440K–$800K. The forced-closure scenario projects $4.8M/year on average. That gap is not because OoC rates are wrong — it is because the scenario assumes all ~83 current people are transferred out, not just the ~22 who are currently housed elsewhere.
How the savings figure changes with the actual bond amount
Shive-Hattery's Life Cycle Cost Analysis contains no debt service at all — no term, no interest rate. The $69.4M savings is a comparison of lump-sum capital plus 20-year operating costs. Once any financing is added, the savings collapse. The table below applies the county's 12-year financing scenario (Piper Sandler matrix, July 29, 2026: total interest = 32% of principal at a 4.45% all-in cost) with the operating component derived from Shive-Hattery's $212M anchor row: $212M − $48.88M lump-sum capital = ~$163M operating over 20 years.
aria-label="Savings sensitivity to bond amount (12-yr county scenario, operating from SH anchor)">| Capital basis | Build New 20-yr total | Forced-closure 20-yr total | Difference |
|---|---|---|---|
| $48.88M (Shive-Hattery Vol I, anchor) | ~$228M | ~$282M | Forced-closure +$54M |
| $79.75M (Shive-Hattery Supplemental) | ~$268M | ~$282M | Forced-closure +$14M |
| $94.5M (adopted bond) | ~$288M | ~$282M | Build New +$6M (roughly break-even) |
Build New 20-yr total = (capital basis × 1.32, the 12-year scenario's principal-plus-interest ratio) + $163M operating. Forced-closure total held at Shive-Hattery's stated $282M. The $94.5M bond covers jail + Sheriff's Office; the $48.88M anchor is jail-only — the scopes do not cleanly align, so the exact break-even figure carries uncertainty in both directions. At 20-year amortization (interest $51.6M per the same matrix), Build New at $94.5M ≈ $309M — about $27M more expensive than forced-closure.
The "$69.4M savings" claim is entirely an artifact of using the Vol I $48.88M planning estimate as the capital basis, and of omitting financing costs entirely. At the adopted $94.5M, once the county's own financing scenarios are counted, Build New and the forced-closure scenario are roughly the same cost over 20 years — and Build New is the more expensive option at any term of 15 years or longer.
The undisclosed population assumption
The forced-closure scenario projects $89.3M in per-diem costs over 20 years. The document states three inputs for this figure: 83 people/day, $60/day starting rate, and 2% annual inflation. Those three inputs do not produce $89.3M — they produce approximately $44.7M. At least one input must differ from what is stated. There are three possible readings:
| If this variable is adjusted… | …it must equal | Notes |
|---|---|---|
| Population (rate and inflation fixed at stated values) | ~170 people/day | Double the stated 83/day; exceeds Build New design maximum of 140 |
| Average per-diem rate (population fixed at 83/day) | ~$147/day average over 20 years | Requires rates roughly 2× the Linn agreement; or an inflation assumption near 8.5%/year rather than stated 2% |
| Inflation rate (population and starting rate fixed) | ~8.5%/year | More than four times the stated 2% assumption |
The document does not disclose which variable was adjusted or why. All three readings require an undisclosed departure from the stated inputs.
The population reading (170/day) has an additional internal inconsistency: Shive-Hattery sized the Build New facility for a maximum of 140 people (120 permanent beds + 20 flexible). The same consultant cannot simultaneously project 170/day future need for the forced-closure scenario and design Build New for a 140-bed maximum — the facility would be undersized on day one of its intended use. If 170/day is the correct population assumption, the ~$288M Build New 20-year total at $94.5M is still understated, because the facility would require a second expansion before the 20-year period ends.
If the stated 83/day population is correct instead, the forced-closure scenario's 20-year per-diem is approximately $44.7M — and the forced-closure 20-year total falls from ~$282M to ~$237M. At the adopted $94.5M, Build New (~$288M) would be approximately $51M more expensive than that corrected forced-closure total over 20 years.